This is Part 18 of the “Frontend Testing, Done Right” series. Browse the full series · Glossary
Open a coverage report and four numbers stare back — Stmts, Branch, Funcs, Lines. Which one matters? This article is about reading that report: which number is honest (spoiler: branch), what to fill in from the red lines, and where to look for the team health that numbers can’t show.
If you’ve been following the series, this is the hands-on follow-up to the strategy part’s point that “coverage is a reference, not a target.” First time here from a search? That’s fine too — we use Vitest, but reading a report works the same no matter which tool you’re on.
Practice code: this part’s state is pinned to the
step-18tag. The coverage config already landed back in the setup part, so the code is identical tostep-17— just runnpm run coverage.
Today’s goal is an eye for the numbers.
- Line vs branch vs function coverage
- Finding the gaps in a report
- Health metrics beyond coverage
Meet the four numbers#
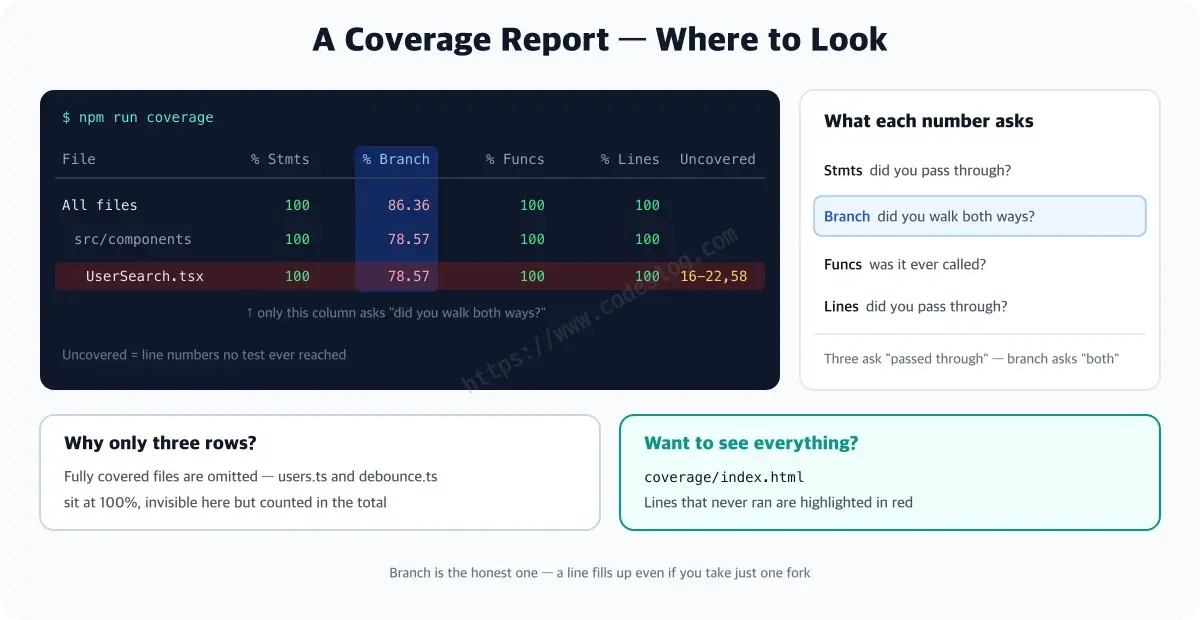
The report’s four pillars, read like this:
- Stmts (statements) — the share of executable units your tests passed through. Moves almost in lockstep with Lines
- Branch — whether you took both sides of every fork:
if/else, ternaries,&&/|| - Funcs (functions) — the share of defined functions called at least once
- Lines — the share of code lines executed. Most intuitive — and, as you’ll see, most generous
One thing to keep: three of the four ask “did you pass through?” — only branch asks “did you take both sides?”
Turning it on#
The environment part’s config already carries it. One trap first — skip the exclude and your mocks and setup files join the denominator, inflating the number. Count app code only. (repo vite.config.ts)
coverage: {
  provider: 'v8',
  reporter: ['text', 'html'],
  // measure app code only: mocks, setup, entry are not coverage targets
  exclude: ['node_modules/', 'dist/', 'e2e/', 'src/mocks/', 'src/test/', 'src/main.tsx', '*.config.ts'],
}npm run coverage
% Coverage report from v8
-----------------|---------|----------|---------|---------|-------------------
File | % Stmts | % Branch | % Funcs | % Lines | Uncovered Line #s
-----------------|---------|----------|---------|---------|-------------------
All files | 100 | 86.36 | 100 | 100 |
src/components | 100 | 78.57 | 100 | 100 |
UserSearch.tsx | 100 | 78.57 | 100 | 100 | 16-22,58
-----------------|---------|----------|---------|---------|-------------------That’s the demo repo’s actual report. “Is that all the files?” — the text table omits fully covered files. users.ts, debounce.ts and friends are all at 100%, so their rows are hidden; they’re still inside the All files totals. Which makes this table effectively a “list of under-filled files.” For the full sweep, open the html reporter (coverage/index.html) — each file shows unexecuted lines in red.
Watch the branch number#
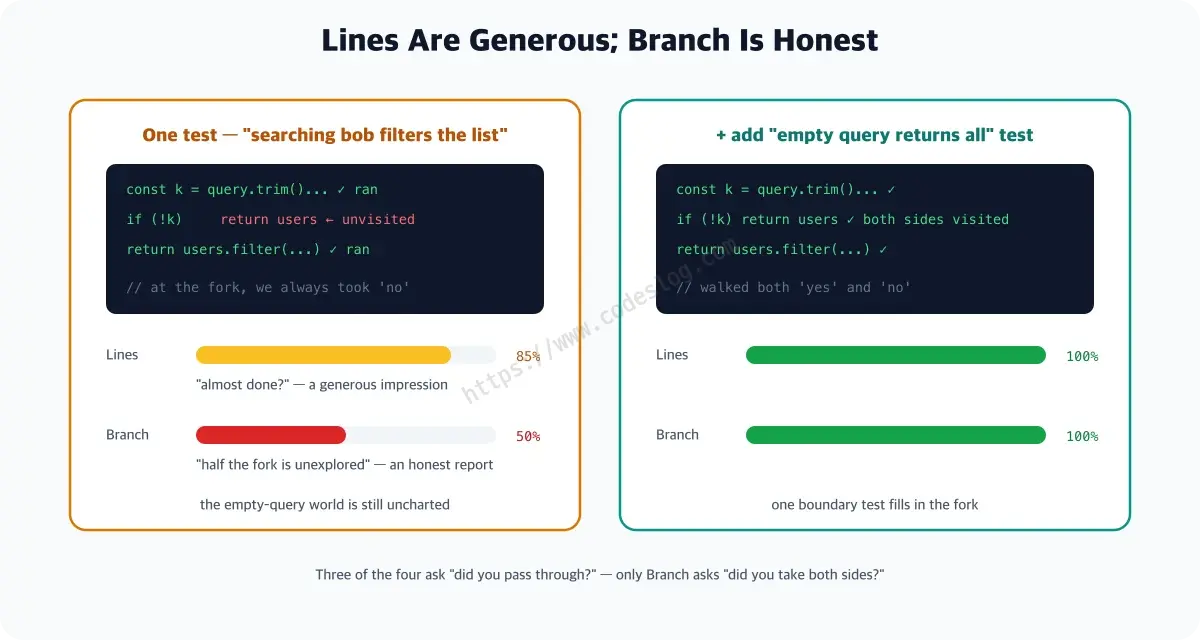
Lines alone will fool you. Let’s experiment with the demo’s filterByQuery.
export function filterByQuery(users: User[], query: string): User[] {
  const k = query.trim().toLowerCase()
  if (!k) return users          // ← the fork
  return users.filter(...)
}
Say we have only one test: “searching bob filters the list.” Nearly every line executes, so Lines reads generously high. But at the if (!k) fork we always walked the “no” side — the “yes” path of an empty query, never once. Only branch coverage honestly reports that as 50%. Add an empty-query test, and both finally read 100%.
This is where the unit testing part’s boundary obsession (“what if it’s empty? missing?”) gets confirmed in numbers.
Now let’s actually read that table#
Theory in hand, back to the real report. Stmts, Funcs, Lines — all 100% — and Branch alone at 86.36%. Exactly what we just learned: three of them gave full marks for “passed through,” and only branch reported “there are forks you haven’t taken.”
Chase the two ranges in Uncovered Line #s back to the code and you get a perfect judgment exercise.
- Line 58 — the “no search results” screen when the query matches zero users. Wait — no test ever verifies this screen. And it’s a path users actually hit. → Worth filling
- Lines 16–22 — the “already gone” side of the guard (
if (active)) that blocks a server response arriving after the component unmounted. Reproducing it means artificially juggling unmount timing, and the logic is one line. → Fine to skip for now
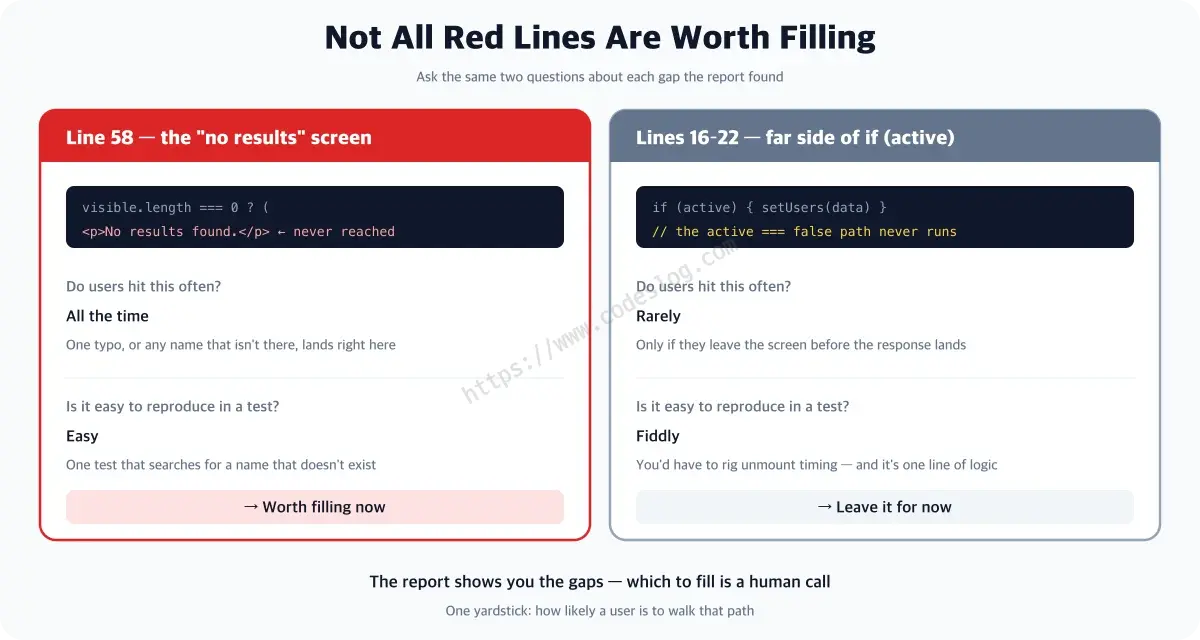
Same red lines, different weights. The report shows you the gaps; a human decides which to fill — and the criterion is “how likely is a user to hit this.”
For finding gaps — and beyond the numbers#
Coverage’s proper use isn’t score-flaunting; it’s finding untested, risky forks. Skim the report’s red lines and fill only the ones that matter.
And team health often shows better in other metrics: flaky rate, average test runtime, mean time to recovery (MTTR). Watch those trends in the reports from the CI pipeline you just built.
One-page summary#
- exclude first — mocks and setup in the denominator inflate the number
- Of the four, branch is most honest — lines fill up even when an if goes one way
- The text table omits fully covered files — it’s effectively a “list of under-filled files”; the full sweep lives in the html report
- Red lines in the html report (
coverage/index.html) = places no test has visited — same red, different weights (how likely users hit it), so fill only the risky forks - The proper use is gap-finding, not score-flaunting — the moment 100% becomes the goal, the strategy part’s traps start growing
- Team health lives beyond coverage too: flaky rate, runtime, MTTR — watch them in CI reports
Wrapping up#
Chapter 4 complete. Now for this series’ highlight — testing in the AI era.
The fastest way to push a coverage badge to 90%… isn’t writing tests. It’s excluding untested files from the report. (Let’s not.)
Level up: you can read a coverage report and fill the gaps that actually matter.
Next up: generating tests with AI — verification stays human
Bumped into an unfamiliar term? The glossary has them all, one line each.
Leave a comment