This is Part 14 of the “Frontend Testing, Done Right” series. Browse the full series · Glossary
“Works on my machine, red on CI.” The homework of everyone who operates E2E, and the prime cause of console.log wallpaper. Playwright ships three tools that solve this mystery with evidence: traces that rewind the failure whole, a UI mode that time-travels, and retries used as a signal. We pack all three today.
Series readers: this is insurance for the day your E2E breaks. Searchers: this is the emergency kit for the test that’s broken right now. Examples are self-contained.
Practice code: this installment’s state lives in the
step-14tag (traces and debugging are about using config and CLI tools that are already there, so there’s no new code — the same state as Part 13 with fixtures). You can also open it in StackBlitz.
Three tools for tracking failure.
- Rewinding the failure with the trace viewer
- UI mode and debug mode
- Retries as a ‘signal’, not a ‘solution’
Why does it break only on CI?#
Let’s clear the mystery first. The CI machine is a different environment from your laptop — usually slower (late loading exposes timing issues), running in parallel, headless, possibly a different timezone and locale. So “breaks only on CI” isn’t the supernatural — it’s a problem you got lucky with locally, caught under harsher conditions. It’s why the locator part’s flaky causes detonate on CI in particular.
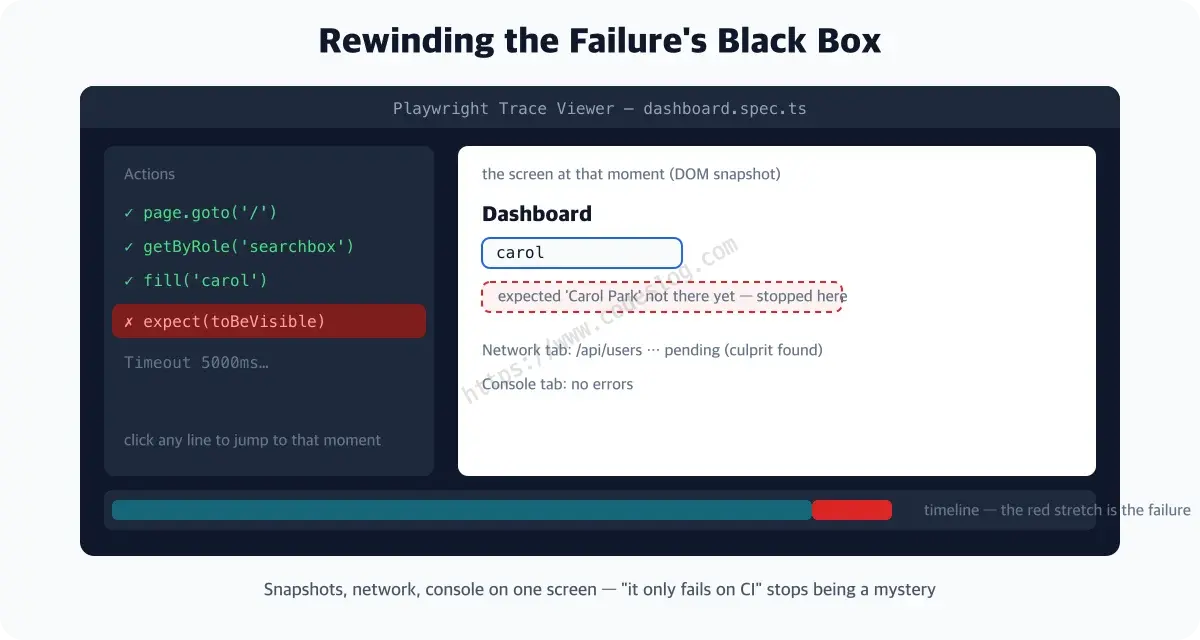
The problem is reproduction. It won’t break on your machine, so you can’t look at it. Hence what you need — a black box of the failure moment.
The trace viewer#
The repo config already includes trace: 'on-first-retry' — recording starts with the first retry. Every step of the failed test can be rewound with snapshots, network, and console.
# record always
npx playwright test --trace on

# open a recorded trace
npx playwright show-trace test-results/**/trace.zip
Run a failing test with --trace on and this is what physically lands in test-results/:
test-results/
└── dashboard-searches-users-on-the-dashboard-chromium/
    ├── trace.zip          ← the black box itself
    └── error-context.md   ← the error and code location as markdown (ready to hand to an AI)
error-context.md is a fun one — open it and you’ll find the failure details bundled with instructions like “explain why this test failed and suggest a code fix.” It’s formatted for pasting straight into an AI (we’ll meet this again in the AI installments later in the series).
What you see inside: the executed action list (goto, fill, expect…) laid out on a timeline; click any action and the screen at that instant (before/after DOM snapshots), the network requests in flight, and the console output replay together. The actual investigation goes:
- CI goes red — with reports uploaded as artifacts (next chapter), download
trace.zip - Open with
show-trace, click the action marked red - Look at that moment’s screen — “ah, the loading spinner’s still up” or “a modal is covering the button”
- Check the network tab — late response? a 500?
- Cause confirmed. By witnessing, not guessing
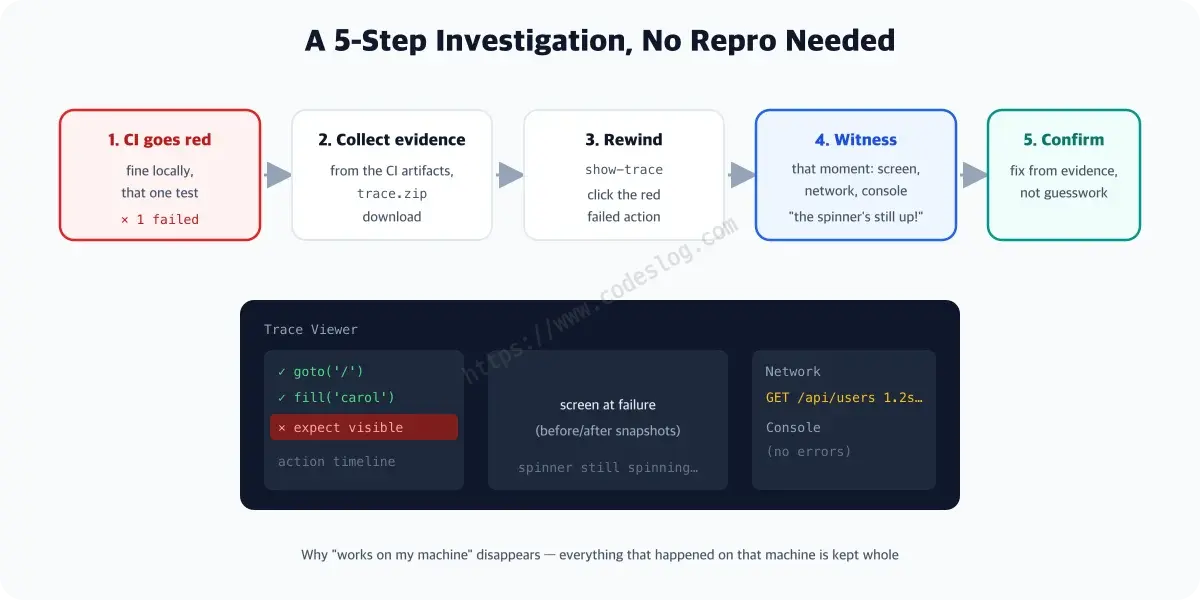
Solving a failure you can’t reproduce, without reproducing it — that’s the trace’s reason to exist.
UI mode and debug mode#
npx playwright test --ui       # run and rerun while watching the timeline
npx playwright test --debug    # step through, pausing at each action
UI mode shows the DOM snapshot at each action like time travel. Seeing where it stopped, with your eyes, changes debugging speed completely.
Retries are a signal#
// playwright.config.ts (already in the repo config)
forbidOnly: !!process.env.CI,
retries: process.env.CI ? 2 : 0,
To see what a retry-pass looks like, I built a test that deliberately fails only on its first attempt and ran it.
Running 1 test using 1 worker
  ✘  1 [chromium] › e2e/tmp-flaky.spec.ts:2:1 › sometimes-failing test (337ms)
  ✓  2 [chromium] › e2e/tmp-flaky.spec.ts:2:1 › sometimes-failing test (retry #1) (174ms)

  1 flaky
Look at the final verdict. The retry eventually passed — yet it says 1 flaky, not 1 passed. Playwright doesn’t cover for the fact that it failed once. And that label is the signal: a test that passed on retry is already a sick test. Don’t shelve it; go back to the locator part’s principles and fix the root.
A bonus: forbidOnly blocks the accident where a test.only left over from debugging drifts into CI and “one test runs, everything green.”
One-page summary#
- Trace = the failed test’s black box — step-by-step DOM snapshots, network, console, rewindable (
--trace on, open withshow-trace) - The repo setting is
trace: 'on-first-retry'— automatic recording from the moment retries begin - Local debugging:
--ui(timeline time travel) and--debug(step by step) — farewell, console.log wallpaper - Retries are a signal, not a fix — a retry-pass is a sick test; treat the root with locator principles
forbidOnlyblocks straytest.onlyfrom reaching CI — and upload reports as CI artifacts for remote autopsies
Mysteries exist to be solved#
Failure isn’t scary anymore. Next is this chapter’s accessibility highlight — scanning whole pages with axe.
The first time you open the trace viewer, you’ll think “why didn’t I know this earlier.” Farewell to the days of console.log wallpaper.
Level up: you can trace the cause of tests that only fail on CI.
Next up: accessibility E2E — scanning with @axe-core/playwright
Bumped into an unfamiliar term? The glossary has them all, one line each.