Introduction#
After you run a survey, someone always asks for a printed copy of the results. If you built the form in Google Forms, the Responses tab already draws you nice charts, so printing that screen straight off should just work, right?
Try hitting print from the responses page, though, and you get one broken page — even though there are plenty more questions below the fold. The pie charts in the Summary tab get sliced in half at the page boundary, too. I ran into this wall myself, and eventually built a tool for it: PrintImg, which splits a tall screenshot into as many A4 pages as it needs.
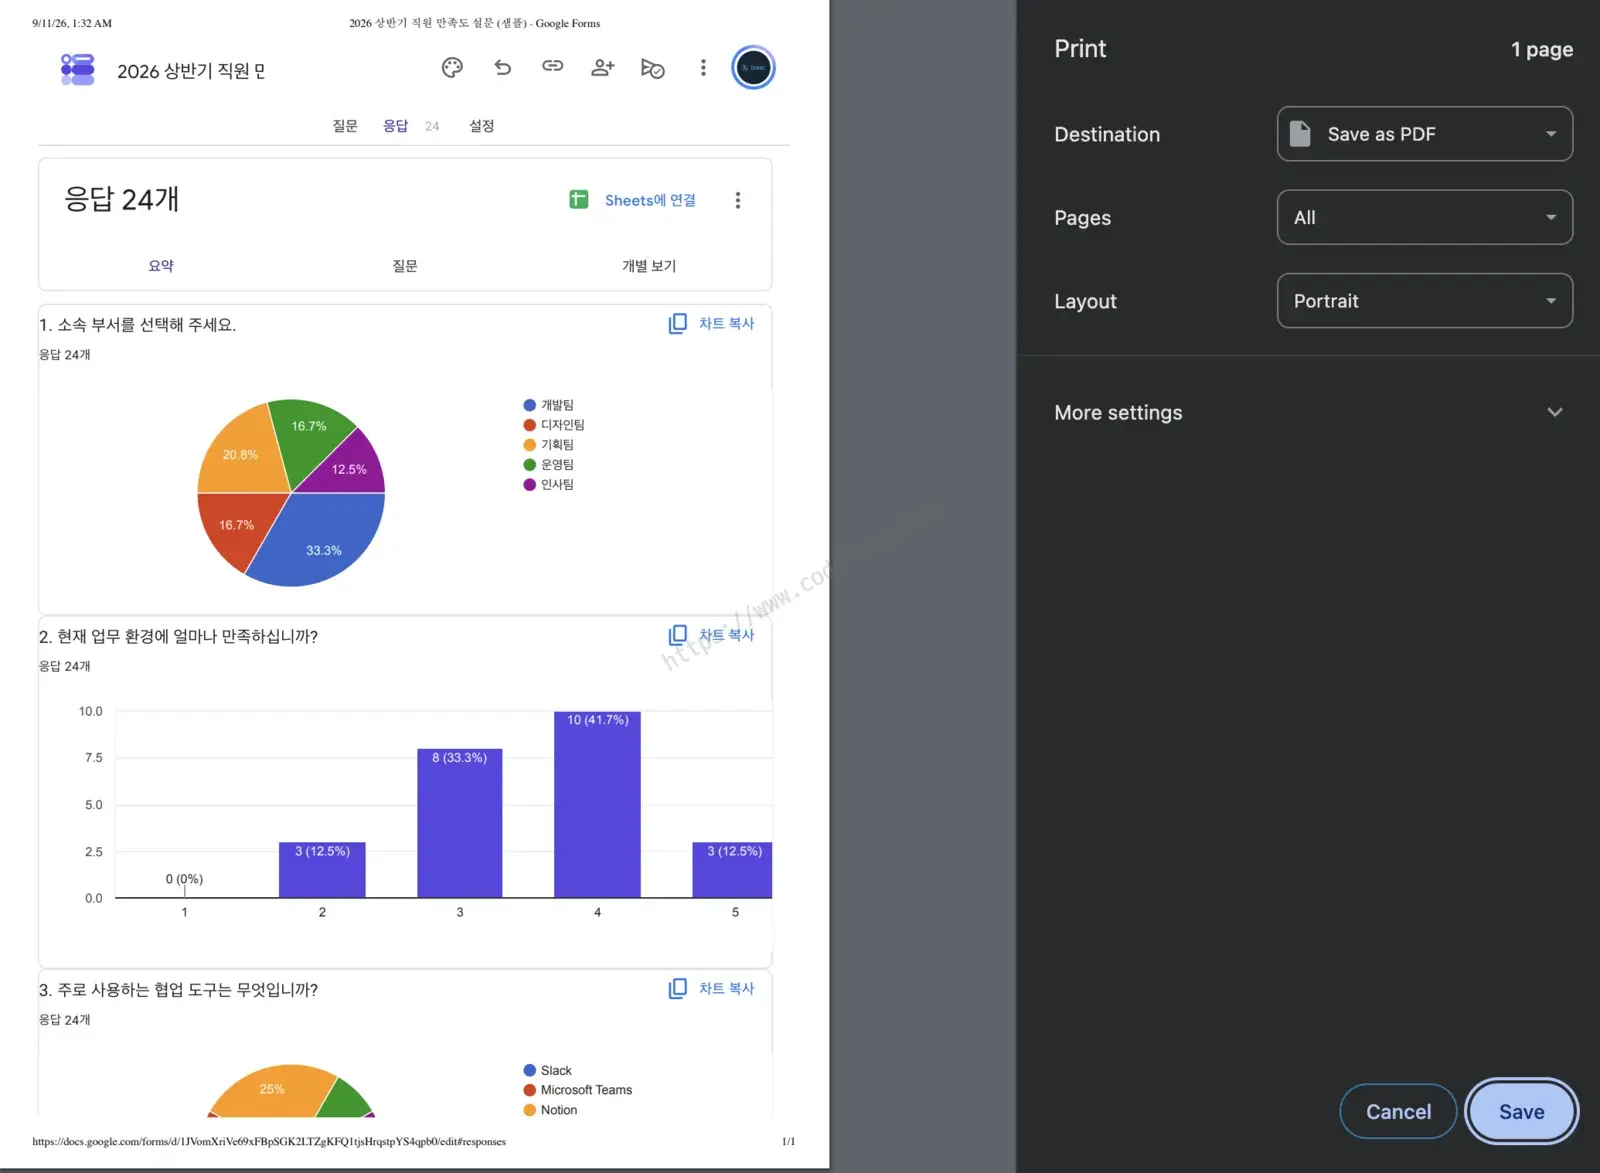
What ⌘P produces from the responses tab of a sample survey (8 questions, 24 responses). The preview shows only 1 page, and the third question's chart is cut off.
This post has two halves. The first is a survey of what other people run into printing Google Forms responses, and how they work around it. The second is how the tool that pushed that workaround all the way looks under the hood. If you just want the tool, skip ahead to Try PrintImg.
Google Forms Officially Gives You Three Ways to Print#
Google Forms has no “Save as PDF” button. Every path runs through the browser’s print dialog, and what comes out depends on which screen you hit print from.
| Method | Where | What you get |
|---|---|---|
| Print all responses | Responses tab → top-right more menu (⋮) → Print all responses | One page per response, bundled into a single document |
| Print one response | Responses tab → Individual → print icon | Just the response you’re currently viewing |
| Print the summary screen | Responses tab → Summary → browser print (Ctrl+P) | The chart summary as shown on screen — but page breaks are left entirely to the browser |
There’s a fourth option too: “Link to Sheets.” Click the green Sheets icon in the Responses tab and you get a Google Sheet with one row per response, and from there you use Sheets’ own print feature. That’s the right call when you need raw tabular data, but the chart summary you were looking at disappears.
The third option is the problem. The summary screen was never laid out for print — the browser ends up slicing a chart down the middle, catching only part of the screen, or leaving the preview blank altogether. In my case, hitting print from the responses page just gave me one broken page.
What Other People Are Running Into — Three Community Threads#
I dug through the Google Docs Editors Community to see how many people have hit the same wall. Three threads tell the story well across time.
February 2020, “How to print the pie charts in the summary without cutting them off?” One question, 21 “Me too"s. The only answer: the report layout in the Responses tab is fixed and hard to touch, so link to Sheets and print from there instead. The thread got locked.
November 2021, “Can I print only the answered responses instead of all 11 pages?” Someone collecting school supply orders through a form asked this. The top answer, from a Diamond Product Expert (Google’s top tier of community answerer), reads:
The Google form should not be used to print data. This is why you are having this issue.
The point: a form is for collecting data, not printing it — go build a report in Sheets with formulas instead. Fair enough. That doesn’t mean the printer stops existing, though.
December 2025, “Google Forms print preview shows a blank page.” A Google Workspace admin at some company posted this one. Across multiple users, multiple devices, both the corporate and home network, Chrome’s preview comes up blank, and it occasionally appears after waiting around five minutes. They cleared caches, reinstalled the browser, turned off hardware acceleration — all of it — and followed up in January 2026 saying “only about 2% work normally.” 39 “Me too"s. The expert who replied couldn’t reproduce it and told them to open a ticket through the admin console. The thread stayed locked in that state.
The three threads share two things. First, Google’s answer has been the same for six years: go to Sheets. Second, what people are actually asking for isn’t Sheets — it’s getting the summary they’re already looking at onto paper as-is. Third parties have been filling that gap. Add-ons like Form Publisher pour responses into a document template and spit out a PDF, and I even found a Korean blog post walking through using Form Publisher to generate a PDF per participant from a training survey. These tools are strong at “one response = one document,” though, which is a different job from printing the summary chart screen as-is.
The Workaround: Capture the Whole Screen — But Then What#
So the workaround a lot of people land on is capturing the full page. A full-page-capture extension from the Chrome Web Store (I use Chrome Capture) shoots the Summary tab from top to bottom as one long PNG. Everything on screen — charts, colors, all of it — comes through.
That’s where the second wall shows up. What happens when you print that image? An image viewer or browser shrinks a 3,900px-tall image down to fit one A4 page, and your text turns to dust. Fit the width instead, and it splits across multiple pages — but where it splits is decided purely by paper size, so a pie chart ends up straddling two pages. You’re back to the original problem.
What I actually needed was simple: fit the width to A4, split the height across as many pages as it takes, and move the cut points into the gaps between cards. I couldn’t find a tool that did that, so I built one.
What PrintImg Does — Fit the Width, Cut on Blank Rows, Clean Up the Background#
PrintImg takes one tall image and splits it into multiple A4-portrait pages. The output is either a PDF file or a print job sent straight to your printer. Four rules govern it:
- Fit the width: scales the image to exactly 100% of the printable area (paper width minus margins). Shrinks or grows as needed. Margins run 0–30mm, 5mm by default.
- Cut on blank rows: after calculating how much height fits on one page, it looks up to 30% above that boundary for the first blank horizontal row, and cuts there. A row counts as blank when, after converting it to grayscale, the gap between its lightest and darkest pixel is 8 or less — so any solid-colored background, white or pale purple, reads as blank. It never searches downward, since overflowing a page isn’t an option. If there’s no blank row in that range, it just cuts at the boundary.
- Background cleanup: estimates the background from the most common color along the capture’s edges and can erase it to white or fade it — handy since printing Google Forms’ pale purple background as-is burns color ink for nothing.
- No trailing near-blank pages: prevents the extra blank sheet that used to print when a capture ran just a few pixels past a page.
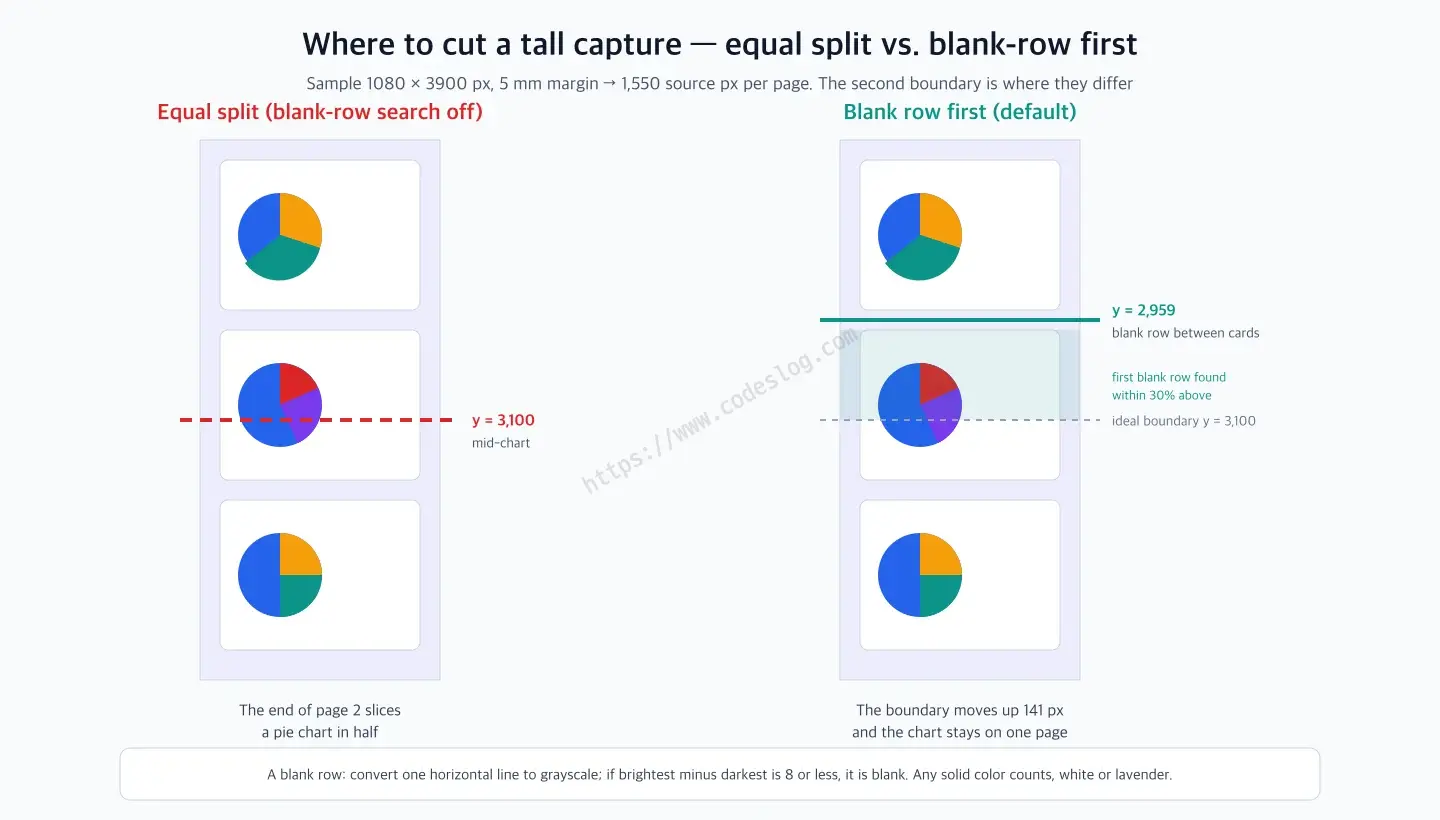
Same capture, different boundary. Moving the end of the second page up by 141px keeps the chart intact on one page.
Talking about it in the abstract doesn’t tell you much, so I counted it out by hand on the sample capture in the repo (1080 × 3900px). At a 5mm margin, the source height that fits one page is 1,550px, and the result is 3 pages.
| Split method | End of page 1 | End of page 2 | Boundaries landing on a blank row |
|---|---|---|---|
| Even split | 1,550 | 3,100 | 1 (1,550 happened to land between cards) |
| Blank-row-first (default) | 1,550 | 2,959 | 2 |
With an even split, the second boundary at 3,100 runs straight through the middle of the third question’s pie chart. Blank-row-first found the gap between cards 141px above that and cut there instead. The first boundary at 1,550 landed between cards either way — that one was just lucky, and real captures usually aren’t.
I Also Ran It on a Real Google Forms Capture#
The sample in the repo is a drawing I made myself, so this time I checked it against an actual Google Form. I built an 8-question employee satisfaction survey, filled it with 24 fake responses (both generated with Apps Script — every response is made up), and captured the response summary page top to bottom. The result is a single 1280 × 3161px image.
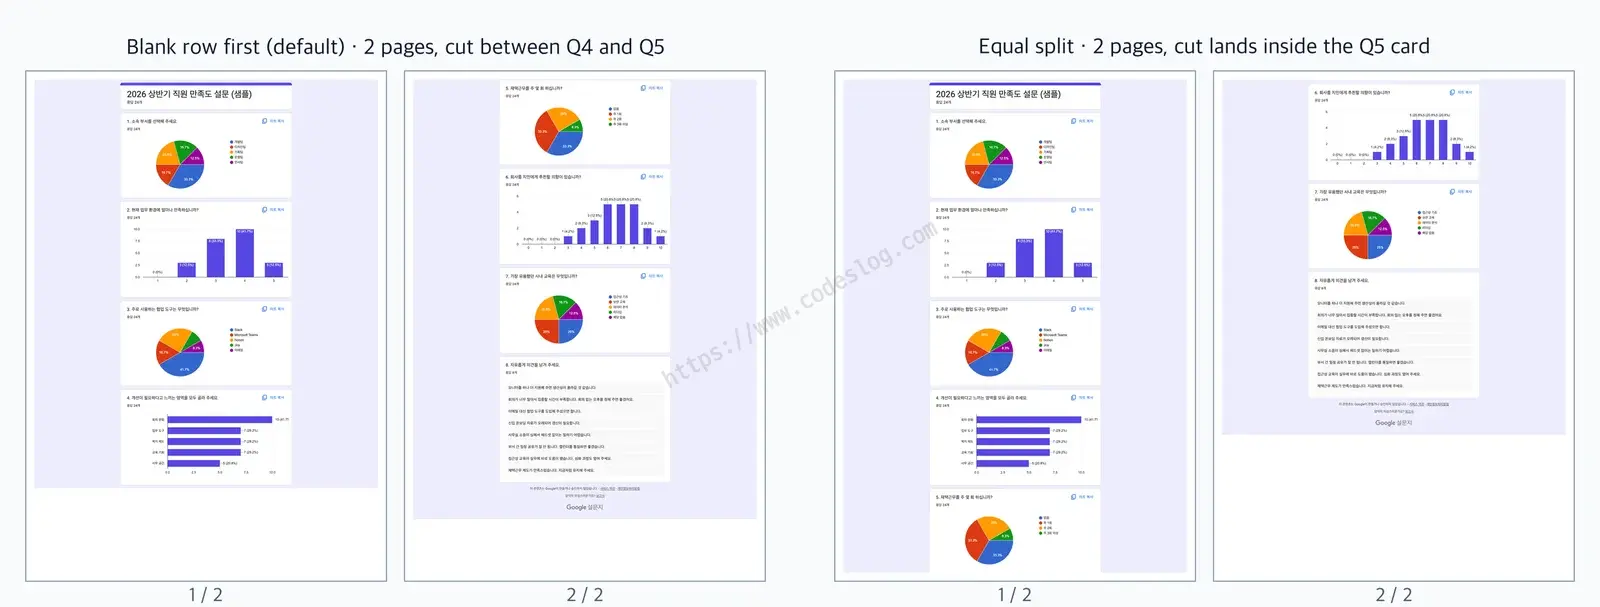
Summary of a survey with 24 fake responses. Left is the default (blank-row-first), right is an even split.
At a 5mm margin, the source height that fits one page is 1,837px, and the result is two pages. With an even split, the first page would end at 1,837 — right inside the card for question 5, “How many days a week do you work from home?” Blank-row-first found the gap between question 4’s and question 5’s cards 314px above that, at 1,523, and cut there instead. The status line reads “2 pages (blank-row cuts 1/1).”
One limitation worth noting: since a single blank row is enough to trigger a cut, it can still cut through the middle of long body text with tight line spacing. It works best on screens with wide gaps between chunks, like chart cards, and doesn’t do much better than an even split on a dense table.
Try PrintImg — No Install, in the Browser#
There are three forms, and they all share the same splitting and background algorithm. The fastest is the HTML version.
- Open https://isaaceryn.github.io/printImg/printImg.html. It’s a single-file page, so if you want it offline, save it and just double-click it.
- Pick an image. A page preview shows up on the right, and the status line below shows how many pages you’ll get and how many boundaries landed on a blank row — something like “Margin 5mm · 3 pages (blank-row cuts 2/2).”
- Print with the Print button, or Ctrl+P (⌘+P on Mac). Switch the destination to “Save as PDF” to keep it as a file.
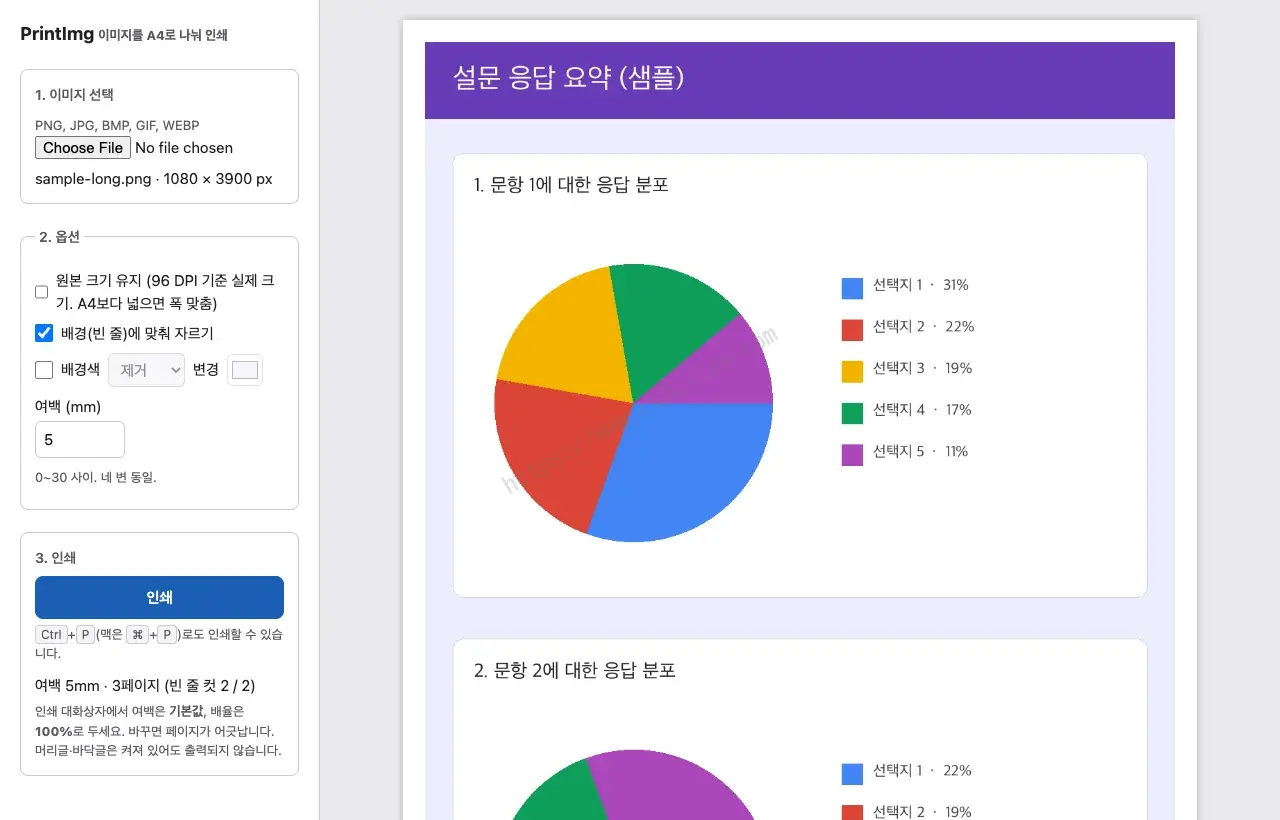
The HTML version. A status line reading '3 pages (blank-row cuts 2/2)' means both boundaries landed on a blank row.
In the print dialog, leave the margins at their default and the scale at 100%. Changing either here throws off the page breaks — the tool has already done the page math, so the browser touching it again just gets in the way. I’ve confirmed this works on Chrome 152; Edge shares the same engine. Safari ignores @page margins and paper size, so you may end up with headers and footers printed on the page.
The capture never leaves your browser. The image is processed entirely client-side and never gets sent anywhere. Survey responses tend to carry personal details like names or affiliations, and this saves you the moment of hesitation before uploading that to some online conversion service.
If you use it often, the app version is more convenient. You can grab PrintImg-1.1.0-win.exe for Windows and PrintImg-1.1.0-mac-arm64.zip for Apple Silicon Macs from the repo’s Releases — no installer needed. The app version has one thing the HTML version doesn’t: picking a printer right from the preview window and printing directly, without ever creating a file. Windows draws straight to the printer through pywin32, and Mac sends it through CUPS (lpr). I’ve printed it out on paper myself to check.
The app isn’t signed by a paid developer certificate, so the first launch triggers Windows SmartScreen or macOS Gatekeeper warnings. All the code is public in the repo, and building it yourself on Mac skips that warning.
One Accessibility Note — the App Can’t Be Read by VoiceOver#
Wouldn’t be this blog without one of these. The macOS app is built with Tk 9.0, and VoiceOver can’t read this version’s Tk widgets. Tk 9.1 is bringing accessibility APIs, which should fix it — until then, if you use a screen reader, use the HTML version instead. It’s built from ordinary form elements: every input has a label, options are grouped in a fieldset, and status text like “3 pages (blank-row cuts 2/2)” is announced through aria-live, so it works fine with a keyboard and screen reader.
What It Can’t Do, and What to Watch For#
- Don’t turn on background removal for a capture with white text on a dark background — the background alone turns white and the text vanishes with it.
- Landscape orientation and anything other than A4 aren’t supported. I haven’t been able to check it against a Letter-size printer.
- The app version stops instead of building a PDF past 50 pages. At that point, you should be splitting the capture up anyway.
- Some home inkjet printers have an unprintable bottom margin wider than 12mm. If the bottom line gets cut off, increase the margin.
- “Keep original size” prints at true size assuming 96 DPI, but any image wider than roughly 755px at a 5mm margin switches to fit-width anyway. Most screenshots fall into that range, so this option only really matters when you don’t want a small image blown up.
One-Page Summary#
- Google Forms has no Save-as-PDF button, and printing the summary screen leaves page breaks up to the browser — charts get cut or you get just one page.
- The community’s answer has been “go to Sheets” since 2020, but people actually want the summary exactly as it appears on screen. The blank-preview issue from December 2025 was still unresolved as of January 2026.
- A full-page screenshot captures the screen faithfully, but printing it either shrinks it down or slices a chart in half.
- PrintImg fits the width to A4 and cuts within 30% above the boundary on a blank row, so a chart stays intact on one page. Both boundaries landed on blank rows between cards in my sample.
- The HTML version runs in the browser with no install and never sends the image anywhere. Just keep the print dialog’s margin at default and scale at 100%.
- The Mac app can’t be read by VoiceOver due to a Tk limitation, so screen reader users should use the HTML version.
질문으로 다시 보기#
Is there an official way to save a Google Forms response summary as a PDF?
Where does PrintImg send my image?
How does it avoid cutting through the middle of a chart?
References#
- PrintImg repository (GitHub, MIT)
- PrintImg HTML version
- How can I print the pie charts in google form summary without the charts being cut off? — Google Docs Editors Community (2020-02)
- Can I print only the answered responses in a Google Form? — Google Docs Editors Community (2021-11)
- Print preview in Google Forms shows blank page — Google Docs Editors Community (2025-12)
- How to Print Google Forms Responses — Form Publisher Blog
- Converting online survey results into a custom PDF format — Shin Seung-sik’s blog